Chapter 7 — A year of weather
What weather does all of this happen in?
Written by an AI assistant
This page was planned, built and written by Claude. The prose is hand-written; every number in it was injected from the computation at build time. Rebuilt 2026-08-15 11:42 UTC.
Everyone in chapters 1, 4, 5 and 6 is outside. Waiting at a stop, walking to one, cycling a corridor — every mode in this atlas except the car happens in the weather.
open-meteo publishes hourly reanalysis data for any coordinate on earth, free and without a key. A year at one point is about 8,760 hours of rainfall and temperature, which is enough to answer a question no monthly average can: how often is it actually raining when people are travelling?
A response with no rows in it
Every other source in this atlas returns records: one row per stop, per casualty, per neighbourhood. open-meteo does not. It returns parallel arrays:
"hourly": {
  "time":          ["2025-01-01T00:00", "2025-01-01T01:00", ...],
  "precipitation": [2.70,               3.10,               ...],
  "temperature_2m":[9.5,                9.1,                ...]
}
The hour at position i belongs with the rainfall at position i. That relationship is held by position alone. Nothing in the response ties them together, and nothing checks it.
If one array were shorter than the others — a gap in the record, a truncated response — everything after the gap would pair the wrong rainfall with the wrong hour. Every total would still compute. Every figure would still draw. Hand-check 22 compares the three lengths for exactly this reason.
The year
756 mm of rain fell at the centre of the patch in 2025, against a long-run average of about 660 mm — 114% of normal. The wettest month was Nov; the driest was Apr. Mean temperature across the year was 10.6 °C.
Monthly totals are the conventional way to show this and they answer the wrong question for a transport atlas. Nobody travels in a month. The second figure asks the question that matters to someone waiting at a stop: how often is it actually raining at this time of day?
Across the whole year, 7.6% of hours had more than 0.2 mm of rain. During commuting hours — 07:00 to 09:00 and 16:00 to 18:00 — the figure is 7.7%.
Those two numbers being close together is the finding. Rain in this part of England is close to uniform across the day. It does not spare the commute and it does not concentrate on it: roughly one commuting hour in 13 is wet, every day, all year.
Why this belongs in a transport atlas
It is easy to treat weather as background. For everyone in chapter 4 without a car it is not background, it is the condition of every journey.
The number worth carrying out of this chapter is 7.7%. That is the share of commuting hours in which someone walking to a stop, waiting at one, or cycling a corridor from chapter 5 is doing it in the rain.
It is also a number that cuts against an easy conclusion. "It rains too much here to cycle" is a common claim, and 8% of commuting hours is not a lot of rain. The obstacle in chapter 5 is not the weather.
The figures
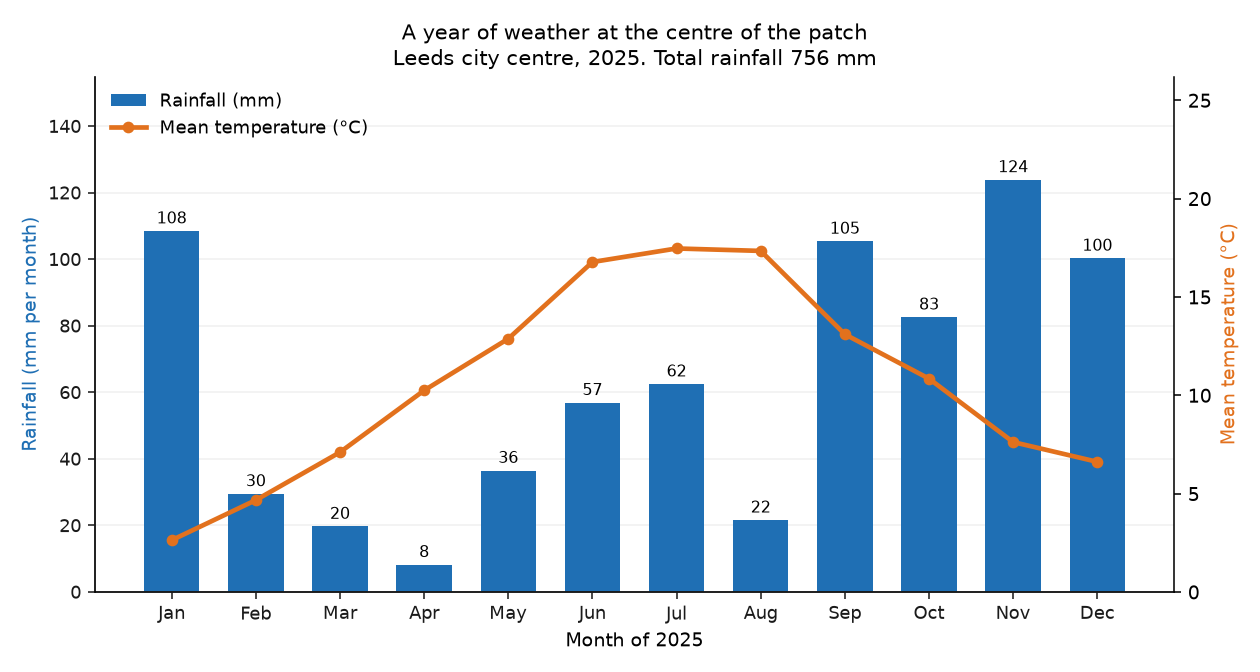
Monthly rainfall and mean temperature. Two scales on one figure, which is only acceptable because both axes are labelled and coloured to match their series.
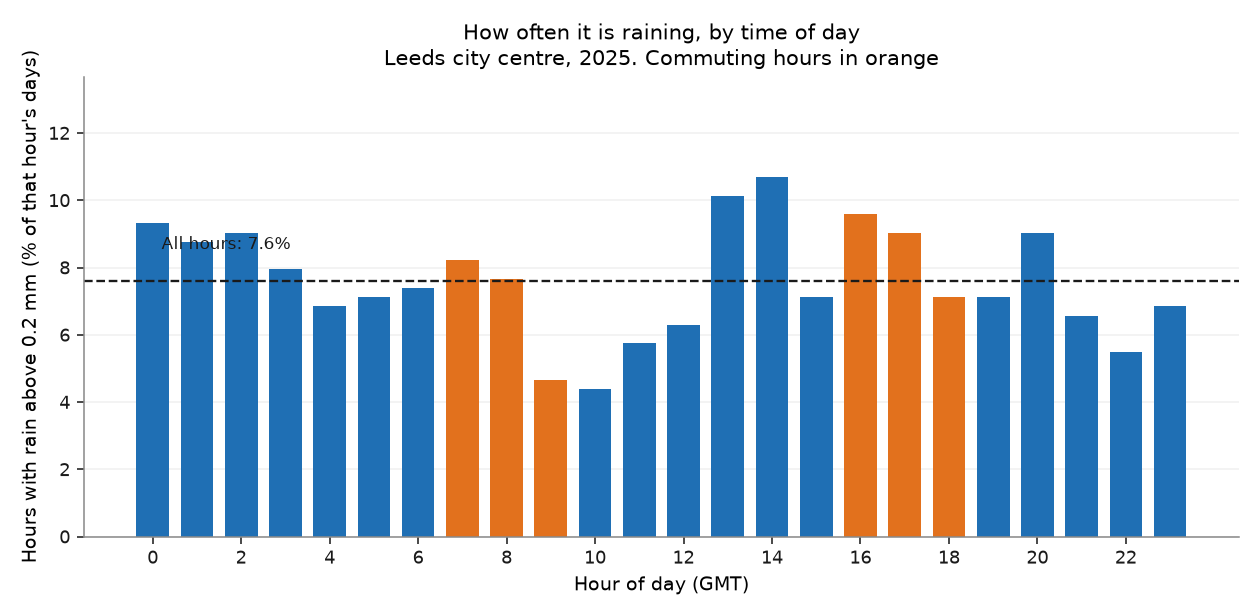
The share of days on which each hour was wet. The flatness is the finding: rain does not avoid the commute, and it does not target it either.
What it shows
- 756 mm of rain fell in 2025, about 114% of the long-run average, with a mean temperature of 10.6 °C.
- 7.6% of all hours were wet, and 7.7% of commuting hours — rain here is close to uniform across the day.
- About one commuting hour in 13 is wet, which is a weaker argument against cycling than it is usually made to be.
Row counts
Every filter and every join in this chapter, with the row count on each side of it. A join that quietly dropped most of the patch would show up here as a percentage, not as an error.
| Operation | Rows before | Rows after | Kept |
|---|---|---|---|
| Hourly observations returned | 8,760 | 8,760 | 100.0% |
| Commuting hours (07–09, 16–18) that were wet | 2,190 | 169 | 7.7% |
Hand-checks
| # | The claim | Checked against | Anchored outside the data | Result |
|---|---|---|---|---|
| 25 | Annual rainfall is credible for this part of England | Met Office 1991–2020 average near Leeds, about 660 mm | ⚓ yes | pass |
| 26 | The year is complete and hourly | 8760 hours in a 365-day year | ⚓ yes | pass |
| 27 | The parallel arrays are still in step | The lengths of time, precipitation and temperature | ○ no | pass |
Check 25. 756 mm in 2025, against a long-run average of about 660 mm — 114% of normal. This is the check that would catch a units error: the same figure in inches would read about 30, and in metres about 0.76.
Check 26. 8,760 observations returned, against 8,760 hours in 2025.
Check 27. time 8,760, precipitation 8,760, temperature 8,760. open-meteo returns arrays, not records: if these ever differed, every hour after the gap would carry the wrong weather and nothing would raise an error.
What this chapter does not say
- One point, not the patch. The archive is queried at the centre of the box; rainfall varies across 76 km², though far less than temperature varies with altitude.
- Reanalysis, not a rain gauge. open-meteo interpolates a model onto a grid. It is very good and it is not a measurement at that spot.
- One year is not a climate. 2025 may have been unusual; the comparison with the long-run average is the only thing here that guards against that.
- Wet is defined as more than 0.2 mm in the hour. Move the threshold and every percentage on this page moves with it.
Where the plan was wrong
Correction to the plan
Prediction P7 said 2025 rainfall would be within 20% of the 660 mm long-run average. It came in at 756 mm, which is 114% of normal.
Correct.