Chapter 5 — Cycling potential
What could cycling here be, rather than what it is?
Written by an AI assistant
This page was planned, built and written by Claude. The prose is hand-written; every number in it was injected from the computation at build time. Rebuilt 2026-08-15 11:42 UTC.
Every dataset so far has been a record. This one is a model.
The Propensity to Cycle Tool takes census commuting flows, the distance and hilliness of each trip, and asks how many of those journeys would be cycled if the population behaved as it does in a different policy world. The Dutch scenario applies Dutch cycling rates for the same distances and gradients to the English population.
That is a useful question and it is not a forecast. Nothing here says cycling will rise. It says how much of the current commuting pattern is, on the evidence of another country, cyclable.
A model, not a measurement
This is the only chapter in the atlas whose subject does not exist.
The PCT starts from Census commuting flows — real journeys between real places — and asks a counterfactual: if the people making these journeys cycled at the rates seen in the Netherlands for the same distances and gradients, how many would cycle?
The answer for this patch: cycling today is about 14,362 cyclist-kilometres a day on the modelled commute network. Under the Dutch scenario it is 94,537 — about 6.6 times as much. The government target scenario sits between, at 26,214.
Three things that number is not:
- Not a forecast. Nothing predicts this will happen.
- Not all cycling. The commute layer covers journeys to work. Shopping, school and leisure trips are absent, and they are most of all cycling.
- Not evenly available. The model applies national relationships to local distances and hills. A corridor with high modelled potential and a hostile road is still a hostile road.
Historic counties
The PCT publishes by region, and its regions are historic counties. Leeds
is in west-yorkshire, which is guessable. Bristol is in avon — a county
abolished in 1996 — which is not.
Ask an assistant for the PCT region name for Bristol and you will get
bristol, confidently. The request succeeds in the sense that it returns
something, and the something contains no segments, and a chapter built on it
produces an empty map rather than an error.
Hand-check 17 exists for exactly that: it asserts that the region returned a network at all.
Why cyclist-kilometres
The obvious way to total a network is to add up the flow on every segment. That is wrong, and wrong in a way that flatters dense city centres.
Segments are not the same length. A 20 m link outside a station with 50 modelled cyclists is not the same quantity of cycling as a 2 km corridor with 50. Summing the flows treats them as equal.
So every total on this page is flow × length, in cyclist-kilometres per day. The patch network is 558 km long across 3,552 segments, and the totals are weighted by that length throughout.
The figures
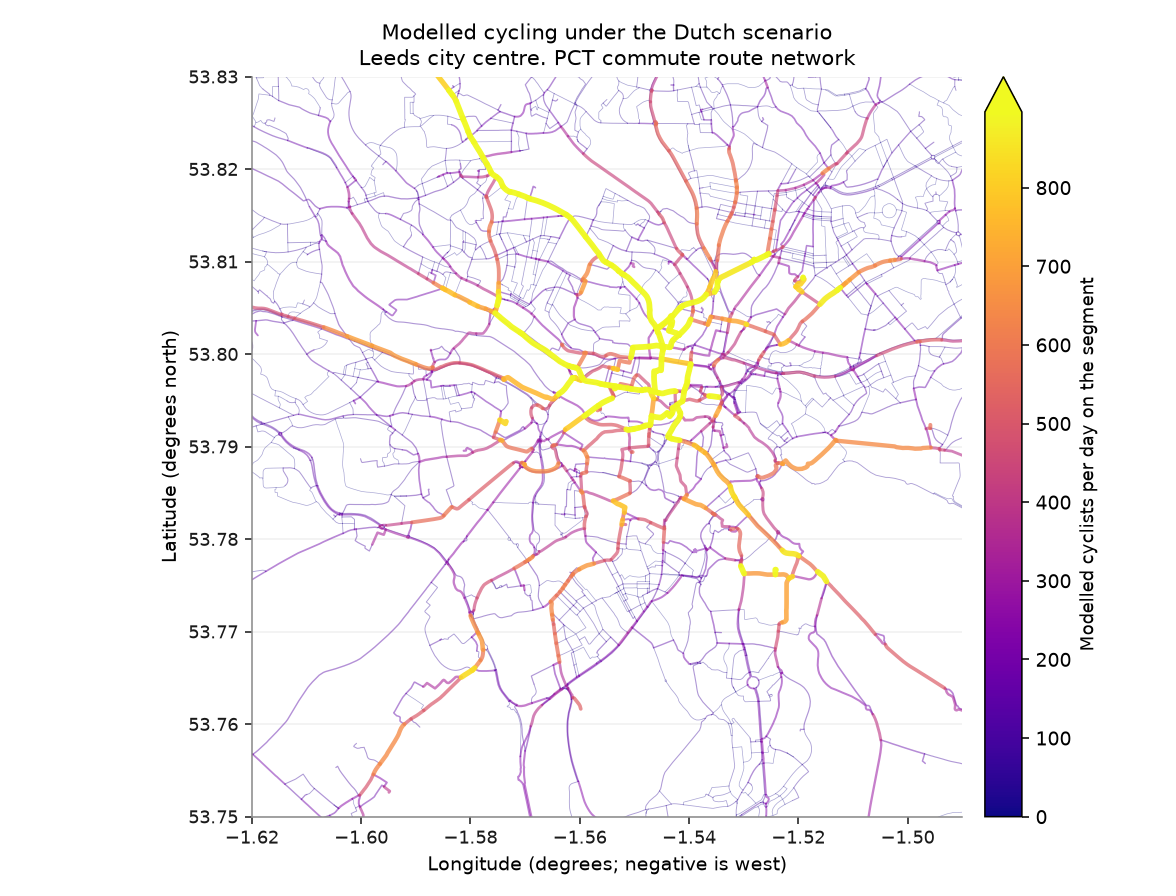
The commuter cycling network the Dutch scenario implies. Line width and colour both carry the modelled flow, so the corridors are legible in greyscale as well as in colour.
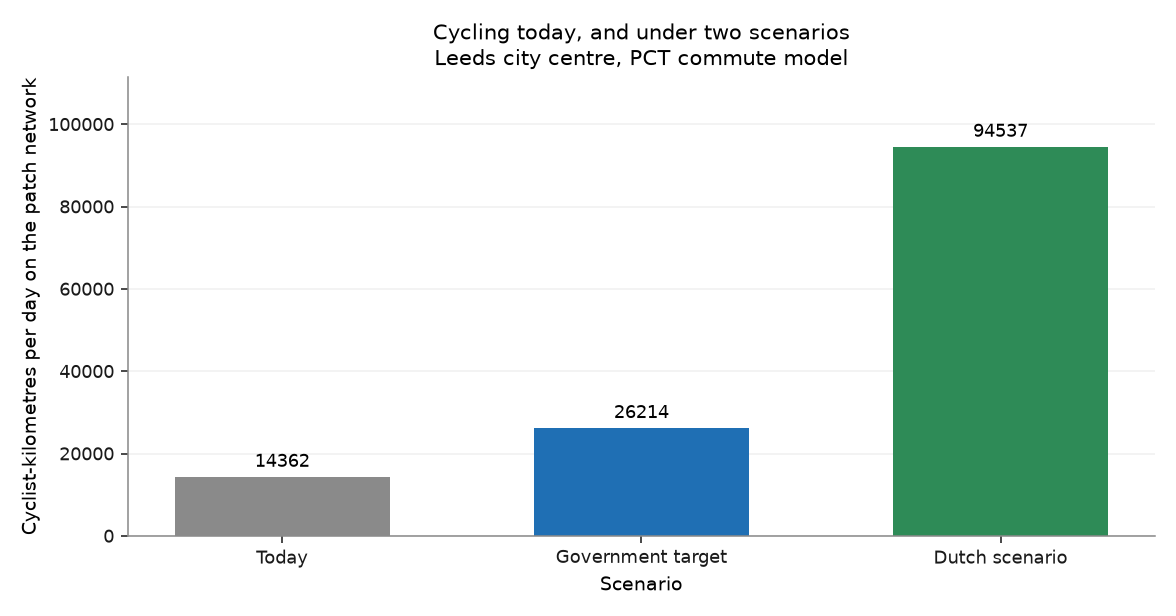
Daily cyclist-kilometres across the patch network. Cyclist-kilometres rather than cyclists, because a busy 20 m link and a busy 2 km corridor are not the same amount of cycling.
What it shows
- The modelled commute network in the patch carries about 14,362 cyclist-kilometres a day today, rising to 94,537 under the Dutch scenario — a factor of 6.6.
- 3,552 segments covering 558 km of network fall inside the patch, of which 3,543 carry modelled cycling under the Dutch scenario.
- The potential is concentrated on a small number of corridors rather than spread evenly, which is what makes the map more useful than the total.
Row counts
Every filter and every join in this chapter, with the row count on each side of it. A join that quietly dropped most of the patch would show up here as a percentage, not as an error.
| Operation | Rows before | Rows after | Kept |
|---|---|---|---|
| Network segments touching the patch | 3,552 | 3,552 | 100.0% |
| Segments with any modelled Dutch-scenario cycling | 3,552 | 3,543 | 99.7% |
Hand-checks
| # | The claim | Checked against | Anchored outside the data | Result |
|---|---|---|---|---|
| 19 | The scenario columns are the right way round | The definitions: today ≤ government target ≤ Dutch, by construction | ⚓ yes | pass |
| 20 | Segment lengths are in metres and are plausible | A city network: total length of the same order as the patch size | ⚓ yes | pass |
| 21 | The region name is the right one | A non-empty network inside the patch | ○ no | pass |
Check 19. Today 14,362, government target 26,214, Dutch 94,537 cyclist-km per day. The Dutch scenario cannot be below today's level; if this ordering broke, the columns would be misread and every sentence here would invert.
Check 20. 558 km of network across 76 km² of city. Degrees treated as metres would have produced a total near 5.02.
Check 21. west-yorkshire returned 3,552 segments touching the patch. PCT regions are historic counties: Leeds is west-yorkshire, but Bristol is avon, a county abolished in 1996. A wrong region name returns a valid, empty answer.
What this chapter does not say
- Commuting only. The PCT commute layer models journeys to work, which are a minority of all trips and a small minority of cycling trips.
- Based on Census travel-to-work data, which is now several years old and was collected during a period of unusual working patterns.
- A scenario is not a plan. High modelled potential on a road with no cycling provision describes demand, not feasibility.
- Segments touching the patch are counted whole. A corridor that enters the box for 100 m contributes its full length here.
Where the plan was wrong
Correction to the plan
Prediction P5 said the Dutch scenario would be at least 5× current cycling. The measured multiple is 6.6×.
Correct.